

Download the report here: Development Analysis of Boston, MA (2013)
Executive Summary
This paper describes an economic analysis of Boston and the Greater Boston region. For the purposes of this analysis, the Greater Boston region includes the counties of Essex, Middlesex, Norfolk, and Suffolk. The central city of Boston is located in Suffolk County. As of 2012, the total population of the region was 3,749,104. These four counties cover a relatively small area but comprise over half of the population of the State of Massachusetts. The region comprises 120 cities and towns.
The purpose of the analysis is to examine the industry sectors within the region and determine potential areas for growth as well as declining sectors. This establishes the industries where there is a competitive advantage in two ways. The region was compared to the United States and in addition, the city of Boston and Suffolk County was compared to the region as a whole. Data was examined from 2001, which was used as the comparison year, as well as 2011 which was used as the base year. When data was unavailable, information was used from the closest available year to the base and comparison years.
First, a demographic analysis was done to determine the assets of the region and establish factors that were relevant to a comprehensive economic development strategy. Then an industry analysis was done to compare employment in various sectors in the region between 2001 and 2011. Finally, an economic base analysis was done including location quotients and shift-share analysis for the region to determine the relative strength of specific industries and to identify growing and emerging industries as well as industries in decline.
Key findings from the analysis revealed that growing base industries in the region include Scientific Research and Development Services, Publishing Industries (except internet), Information, and Transit and Ground Passenger Transportation. Industries that are emerging as potential growth sectors include Arts, Entertainment, and Recreation and Accommodation and Food Services. The sectors of Health Care and Education, while having large rates of employment, have less room for growth and are transforming industries. Other industries such as Construction and Manufacturing are considered to be declining and not worth further development.
1. Demographics
POPULATION
The total population of the 4-county region in 2011 was just under 3,675,000 people. In Suffolk County in 2011 the population was 730,932. The average population of the counties in the region which includes Essex, Norfolk, Middlesex, and Suffolk Counties was 918,367 with the majority of the population living in Middlesex County, a total of 1,518,171 people. Since 2000, Suffolk County has increased in population by 41,125. Between 2000 and 2011, the region as a whole expanded by an average of 36,135 persons across all four counties.
AGE
The age distribution is even across the region, with the majority of residents between 25 and 54 years of age. The average age of persons in Suffolk County was less than the region as a whole. The average age of persons living in Suffolk County in 2011 was 31.7 while the average of the region, not including Suffolk County, was 40 years. This is up from 2000 when the average age of the region was 37.3. However, the average age of Suffolk County has remained the same. In 2011, most people living in the region were between 45 and 54 years of age while the majority of people living in Suffolk County were between the ages of 25 and 34.
ETHNICITY
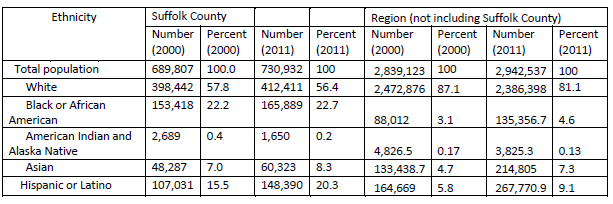 The vast majority of the region as a whole identified as white. Compared to the rest of the region, Suffolk County was significantly more diverse. In 2011, excluding Suffolk County, the region was 81.1% white compared to Suffolk County only which was 56.4% white. The diversity of the region has increased slightly since 2000. In 2000, the region was 87.1% white, excluding Suffolk County. Suffolk County only was 57.8% white.
EDUCATION ATTAINMENT
The educational attainment of individuals in the region has been even across all four counties from 2000-2011. As of 2000, the majority of individuals over 25 had attained a Bachelor’s degree or higher with 37.57% of the population. 25.35% of the population in the region ad attained a high school diploma or equivalent in 2000.
By 2011, 43.88% of individuals in the region had attained a Bachelor’s degree or higher while the percent of those who attained a high school diploma decreased to 23.43%. This shows that attainment of college and graduate degrees are on the rise in the region.
Both Essex and Suffolk County have consistently lagged behind the other two counties in educational attainment by about ten percentage points in 2000 as well as 2011. Attainment of college and graduate degrees continues to increase at a sharper rate in Norfolk and Middlesex County than in Essex and Suffolk County.
HOUSING
In 2011 there were a total of 1,510,445 housing units in the Greater Boston region. 93.9% of the housing units in the region were occupied. This is down from 2000 when there were 1,411,499 housing units and a 96.5% occupancy rate.
Suffolk County has significantly less owner-occupied housing than the rest of the region. In 2011, 64.97% of the housing units in the Greater Boston region were owner occupied, excluding Suffolk County. Suffolk County on its own had an owner-occupancy rate of 34.9% and 65.1% were occupied by renters. The owner-occupancy rate in the Greater Boston region in 2000, excluding Suffolk County was also 64.97% while the owner-occupancy rate of Suffolk County was 33.9%.
The Greater Boston region has a substantial amount of older housing stock. As of 2011, about 40% of the housing units in the region were built earlier than 1939. In the same year, the majority of the houses in the region were worth between $300,000 and $499,999.
2. Quality of Life
CLIMATE
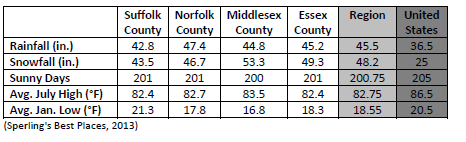 Compared to the national averages, the region has relatively more precipitation; however, the number of sunny days compare favorably against the national average. The summer and winter temperature highs are also close to the national averages.
HOUSING AFFORDABILITY
According to the National Association of Realtors’ Affordability Index of Existing Single-Family Homes for Metropolitan Areas, the region rates 128.4 with 7.4% affordability, a significant contributor to the region’s high cost of living. (National Association of Realtors, 2013)
K-12 EDUCATION
Spending per student
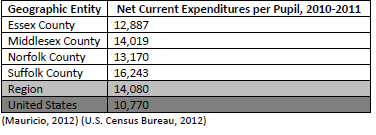 Compared to the national average, the region does spend significantly more per student with Suffolk County spending the most money.(Mauricio, 2012) (U.S. Census Bureau, 2012)
High school graduation rate, 2009-2010
 The region is doing better than the national high school graduation rate. It is important to note that there are disparities between the counties in the region, more specifically Suffolk County. Norfolk County had the highest graduation rate for 2010.
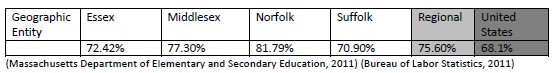 Again, the region compares favorably to the national average for the percentage of high school students going on to college for 2010. Also, Norfolk County again has the highest percentage with Suffolk County coming in last.
HEALTH CARE
With Boston as the medical epicenter, access to quality health care in the region is not an issue. The following is a list of some the highest rated hospitals in the region:
- Massachusetts General Hospital (Boston)
- Brigham and Women’s Hospital (Boston)
- Beth Israel Deaconess Medical Center (Boston)
- Boston Children’s Hospital (Boston)
- Lahey Clinic (Burlington)
- Newton-Wellesley Hospital (Newton)
- North Shore Medical Center (Salem)
(U.S. News & World Report, 2013)
CRIME RATE
 The region’s violent crime rate is slightly higher than the national average. However, the region’s property crime rate is less than the national average. Note that Violent Crime includes murder, non-negligent manslaughter, forcible rape, robbery, and aggravated assault while Property Crime includes the following: burglary, larceny-theft, and motor vehicle theft.
CULTURE
The region is rich with various forms of entertainment, which include museums, performing arts, and various events. The following is a list of selected cultural amenities that the region has to offer.
Museums
- Museum of Fine Arts
- Institute for Contemporary Art
- Isabella Stewart Gardner Museum
- Harvard Art Museums
- Kennedy Library and Museum
- Boston Children’s Museum
- Museum of Science
- New England Aquarium
Performing Arts
- Boston Ballet
- Boston Symphony Orchestra
- Citi Performing Arts Center
- Boston Opera House
- Bank of America Pavilion
- Comcast Center
Sports Teams
- New England Patriots – Gillette Stadium: Foxboro, MA
- Boston Red Sox – Fenway Park: Boston, MA
- Boston Celtics – TD Garden: Boston, MA
- Boston Bruins – TD Garden: Boston, MA
- New England Revolution – Gillette Stadium: Foxboro, MA
Outdoor Amenities & Activities
- Boston Harbor Islands
- Minuteman Bikeway
- Foxboro State Forest
- Blue Hills Reservation
- Braintree Municipal Golf Course
- Moose Hill Wildlife Sanctuary
- Blue Hills Ski Area
(Massachusetts Office of Travel & Tourism, 2013)
3. Income and Wages
MEDIAN INCOME AND INCOME DISTRIBUTION
The Median income for households and families in the Greater Boston region has increased from 1999-2011. However, this increase has not been even across the entire region. The table below shows that median income of the region, excluding Suffolk County, has increased at a much steeper rate over the twelve-year period.
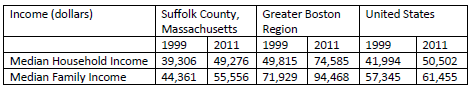
The table also shows that compared to the United States, median income in the Greater Boston Region has been consistently above the national average. However, Suffolk County has fallen below the national average for median income for both household and family income. Suffolk County also has the highest percentage of households in the region earning less than $10,000; 13.5% compared to 5.6% for the region in 2011.
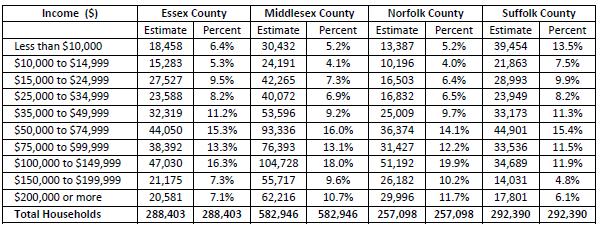 The largest bracket for household earnings in the region, excluding Suffolk County, was between $100,000 and $149.99, about 18% in 2011. The largest earnings bracket for households in Suffolk County was $50,000 to $74,999. The table below shows the distribution of household income across the four counties in the region in 2011:
HEALTH CARE
As of 2011, 95.8% of the population in the Greater Boston Region had health care insurance coverage, including both those in the labor force and unemployed persons. This is above the national average in 2011 which was 84.9% among the civilian noninstitutionalized population. Of the unemployed population in the Greater Boston region, 85.7% have health care insurance coverage.
The vast majority of persons in the region have private health care insurance as opposed to public; 86.2% private insurance compared to 11.1% public. This indicates that most individuals obtain health care insurance from their private employer.
POVERTY
The percentage of families living in poverty in the United States in 2011 was 11.7%. This is higher than the Greater Boston region, excluding Suffolk County which is 6.1%. Suffolk County has a significantly higher percentage of families living in poverty compared to the region with 17.6%. This is also higher than the national average.
In the United States, the largest age group of people living in poverty in 2011 was people under 18 years of age with 22.5% of people in poverty. This is also true for the Greater Boston region. The region average for people under 18 living in poverty, excluding Suffolk County, was 10.6%. However Suffolk County was significantly higher with 31.7% of people under 18 years living in poverty.
4. Civilian Labor Force Characteristics
UNEMPLOYMENT RATE
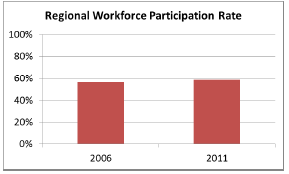 The average workforce participation rate in the region is just under 60%, and has grown slightly since 2006 according to ACS data – see graph to the right. This value represents the total percent of individuals employed for 50-52 weeks out of the labor force of individuals aged 16-64 (Census, 2011).
The unemployment rate in the region generally mimics that of the reference unemployment rate in the US as a whole. From 1991 to 2013 the unemployment rate in the region has decreased from 8% to just above 6% today, with the lowest rate achieved from around 1996 – 2001 at about 4%. From 2004 – 2011 the unemployment rate in the US and the region skyrocketed up to 9% and 7% respectively. In general, the Region seems to have more structural stability to abate national changes in the unemployment rate. See graphical representation of this data below.
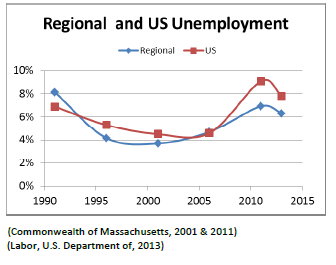 By county, the unemployment in Essex seems to lag about 5 years behind the trends experienced in the region and the reference United States. The unemployment rate in Middlesex, the major employment county in the region, also appears to be both volatile and somewhat disconnected from the rates experienced in the neighboring counties and in the US reference. See graphical representation of unemployment rate by county on the next page. (Commonwealth of Massachusetts, 2001 & 2011)
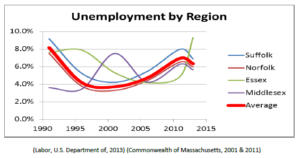
(Labor, U.S. Department of, 2013) (Commonwealth of Massachusetts, 2001 & 2011)
COMMUTING
United States
![]() In the US on average, over 85% of workers drive to their jobs, 5% use public transit, and about 3.5% bike or walk (Administration, U.S. Department of Commerce – Economics and Statistics, 2011). In New York City, just 25% drive, while over 50% take public transit and more than 10% walk or bike. From 2000 – 2010, the average commute time in the US has held steady, around 25 minutes (Administration, U.S. Department of Commerce – Economics and Statistics, 2011; Bureau, U.S. Census, 2000).
In the US on average, over 85% of workers drive to their jobs, 5% use public transit, and about 3.5% bike or walk (Administration, U.S. Department of Commerce – Economics and Statistics, 2011). In New York City, just 25% drive, while over 50% take public transit and more than 10% walk or bike. From 2000 – 2010, the average commute time in the US has held steady, around 25 minutes (Administration, U.S. Department of Commerce – Economics and Statistics, 2011; Bureau, U.S. Census, 2000).
The rate of commuting by car in Boston is steadily declining, down from 75.4% in 2005 to 72.6% in 2011. The public transit use has grown slightly to just under 15% of all commuters, while the number of walkers and bicyclists has also (Labor, U.S. Department of, 2013) increased slightly to just under 7.5% combined. There are increasing numbers of people working from home, making up 4.5% of all workers in 2011, up from 3.4% in 2005. While the use of public transportation and alternative forms of commuting are higher in Boston, the average commute time is also 4 minutes greater than the average for the US, at almost 29 minutes per trip.
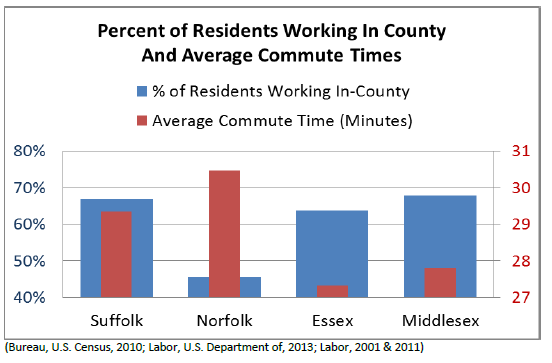
(Bureau, U.S. Census, 2010)(Bureau, U.S. Census, 2010; Labor, U.S. Department of, 2013; Labor, 2001 & 2011)
INDUSTRY
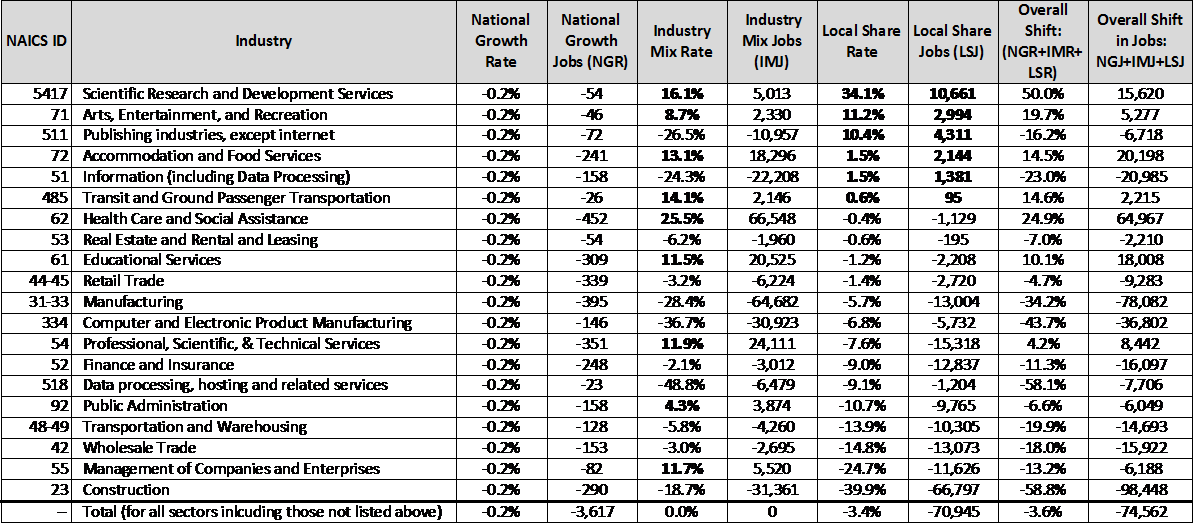
In 2011, there were 2,011,862 employees in the Greater Boston region compared with 2,086,424 in 2001, a decline of 74,562 employees or 3.6%. Many industry sectors saw significant declines in employment during this period including Construction which lost close to 100,000 jobs and Manufacturing which lost close to 80,000 jobs.[1]
One notable exception was the Scientific Research and Development Services subsector, which grew by 15,620 employees, an increase of 50% from 2001. This subsector includes employment in R&D focused on Engineering, Physical & Life Sciences, Biotechnology, Social Sciences, and the Humanities. Writer Richard Florida classifies occupations in this subsector as part of what he calls the Creative Class. For this reason it is not surprising that in 2010, employees in creative class occupations in the Boston-Cambridge-Quincy, MA-NH MSA, of which the Greater Boston region is a part, made up 41.6% of the region’s total employment, the sixth highest MSA creative class share in the country (Florida, 2011, p. 404). The Health Care and Social Assistance sector also grew by 64,967 employees or 25% during this period, increasing in industry share from 13% to 16%. For a full breakdown of employment changes between 2000-2011 in key industry sectors affecting economic development see table below (Labor, 2001 & 2011), (Commonwealth of Massachusetts, 2001 & 2011).
For a graphical representation of changes in employment between 2001-2011 for the main industry sectors, see graphs below:
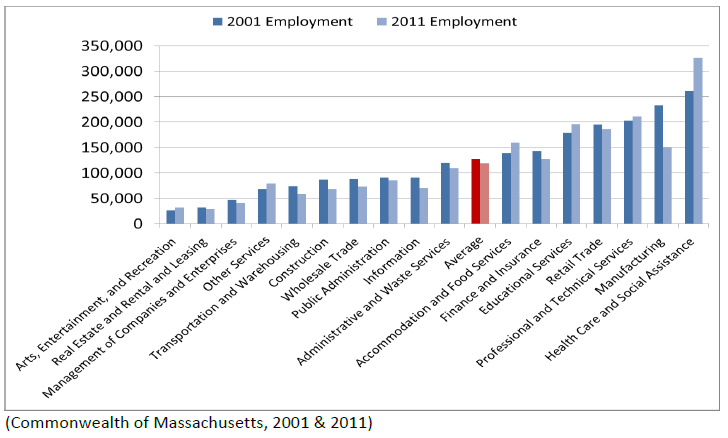
(Commonwealth of Massachusetts, 2001 & 2011)

(Commonwealth of Massachusetts, 2001 & 2011)
ECONOMIC BASE ANALYSIS
Location Quotient Analysis
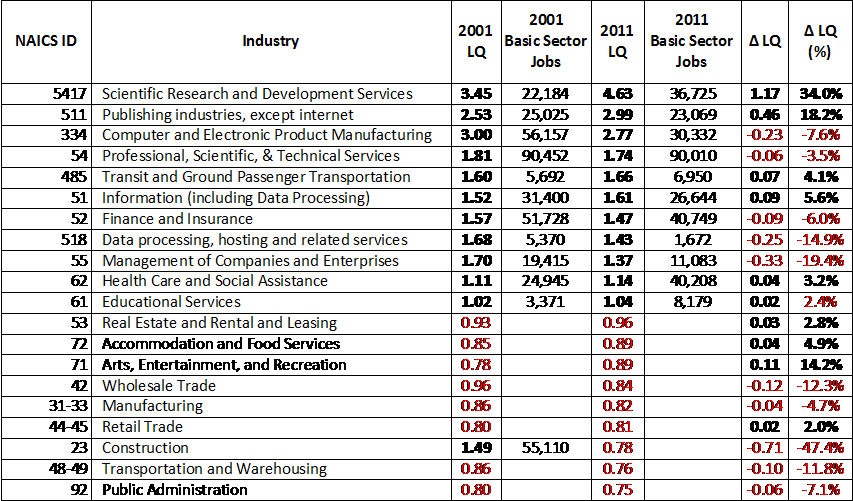
Despite many industry sectors seeing significant declines in employment between 2001-2011, all of the industry sectors classified as strong exporters in 2001 based on their relative strength compared to national employment numbers (having an LQ>1.25) except for Construction remained strong exporting industries for the region in the 2011. The strongest sectors including Scientific Research and Development Services, Publishing Industries (except internet), Transit and Ground Passenger Transportation, and Information saw their industry export strength increase even further between 2001-2011, bringing additional wealth into the region. These sectors as well as those that remained strong (LQ>1.25), but saw a decrease in LQ between 2001-2011 including Computer and Electronic Product Manufacturing, Professional & Technical Services; Finance & Insurance; Data Processing/Hosting Related Services; and Management of Companies & Enterprises can be described as niche sectors for the regional economy able to remain strong export industries despite the overall decline in regional employment in part due to the fact that they are largely creative class based industry sectors (Florida, 2011). As sectors able to weather the recession both the region (and the country) faced during this time period, these sectors are worthy of additional investment in the future.
For a complete breakdown of the change in each industries’ LQ between 2001-2011 as well as the amount of jobs each sector with an LQ>1 exported (basic sector jobs) above what the region needed to meet its needs, see table below (Commonwealth of Massachusetts, 2001 & 2011), (Labor, 2001 & 2011).
Shift-Share Analysis
While the 0.2% decline in the national growth rate between 2001-2011 contributed to a loss of jobs in all industry sectors, the change in employment in any given sector that can be attributed to the declining national growth rate is miniscule when compared to the industry mix rate (proportional shift), and local share rate (differential shift). Many of the sectors that had the highest LQs including Scientific Research and Development Services, Publishing Industries (except internet), Information, Transit and Ground Passenger Transportation also had positive local share rates meaning that existing conditions in the local economy gave these industries a competitive advantage when compared to the national economy. It is not an accident that these industries (except for transit and ground transportation) contain high concentrations of creative class occupations; a term first coined by writer Richard Florida (Florida, 2011, p. 401). Because these industries had gains in their LQ as well as local share during this period they can be classified as the growing base industries, which as highly concentrated, competitively advantaged industries are key to future economic development in the region.
Still other sectors such Arts, Entertainment, and Recreation as well as Accommodation and Food Services which had increases in their LQ between 2001-2011, but remain non-basic sectors with an LQ approaching, but <1, also had increases in their local share of jobs of 11.2% and 1.5% respectively. As industries with lower local-concentrations of employees that have a local competitive advantage, these sectors can be classified as emerging industries for the region, which given additional incentives/investment have additional room to grow in concentration.
The sectors with 2011 LQs above 1 that also saw an increase in LQ from 2001, but have a declining local share of jobs including Health Care and Education, which given their high concentration, but a lack of a local competitive advantage can be classified as transforming industries.
Finally, the majority of the other industry sectors not listed such as Construction and Manufacturing have LQs <1 and saw a decline in their local share of jobs making them declining industries which are less likely to contribute to the region’s economic development going forward.
Note that there are some industries which don’t fall squarely into one of these four categories, namely industries such as Finance & Insurance, and Professional & Technical Services which still remain highly concentrated, exporting industries with 2011 LQs significantly above 1, but who saw an overall decline in LQ from 2001-2011 as well as a decline in their local share of jobs. These industries while still contributing to economic development as highly concentrated, exporting industries deserve further analysis beyond the scope of this report to determine whether future economic development strategies should include them or not.
For a complete breakdown of each sectors 2001-2011 employment shift broken down by national growth, industry mix, and local share see the table on the next page.[2]
(Commonwealth of Massachusetts, 2001 & 2011), (Labor, 2001 & 2011)
5. Business Establishments by Industry Sector and Employment Size
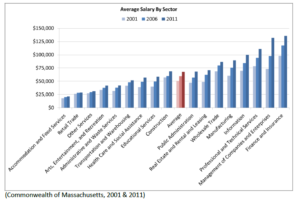
In the 4-county region there were about 2,000,000 employed individuals in 2011. Of the 2 million employees, about 16% worked in the Health Care industry, 11% in the Professional and Technical industries, 10% in the Educational Services sector, and almost 10% in the Retail Trade industry. The Finance and Insurance sector and the Management of Companies sector comprised just 6% and 2% of employees respectively, but had the highest average salaries of all sectors.

(Commonwealth of Massachusetts, 2001 & 2011)
In the 4-county district region, there is a healthy blend of industrial sectors and employment spread across several main sectors. The Healthcare sector provides the most employment opportunities, with about 325,000 jobs in the region (16% of total employment). Employees in the healthcare industry on average receive slightly below the regional salary, with an annual income of $55,000 as compared to the regional average salary of $68,000.
The Professional and Technical Services sector makes up the second highest employment sector with over 200,000 jobs (more than 10%), and a very high average salary of about $130,000. These jobs include accounting-related services, legal services, computer software engineers, and clerical services.
The Educational Services sector is the third-highest employment sector in the region, with just under 200,000 jobs at an average salary of about $60,000.
Retail Trade and Accommodation and Food Services sectors both employ over 150,000 individuals, with salaries well below the regional average at $30,000 and $21,000 respectively.
Manufacturing employment is centralized predominantly along the I-495 highway area of the region, and supports almost 150,000 jobs with a high average salary of almost $90,000.
The Finance and Insurance sector employs individuals engaged in financial transactions, fund raising, insurance and annuities, and other financial services. Over 125,000 employees work in this sector, and receive the highest average wage of more than $130,000.

(Commonwealth of Massachusetts, 2001 & 2011)
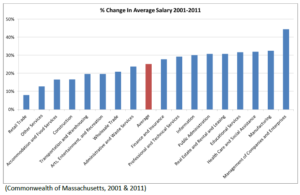
 The following chart examines the growth in salaries by sector from 2001 to 2011. Relative to the 2001 income, the Management of Companies sector had the largest gain in salary, with a 44% increase from 2001-2011. The Information, Public Administration, Real Estate, Educational Services, Health Care, and Manufacturing industries all had increases of over 30% in this time period, above the average of 25% increase. The Finance and Insurance sector, the highest-earning sector, saw a 28% increase from 2001-2011, slightly above the regional average. The Construction and Retail Trade industries saw the smallest gains, with just 3% and 8% respectively.
(Commonwealth of Massachusetts, 2001 & 2011)
6. Higher Education Resources
Suffolk County is densely packed with high caliber institutions of higher learning, which represent a wealth of resources for local economic development. According to the Boston Redevelopment Authority, Boston is home to “35 colleges universities, and community colleges” (Boston Redevelopment Authority, 2011). With over 152,000 students and counting, there are many opportunities to tap into the knowledge base to gain support for such activities as small business development centers.
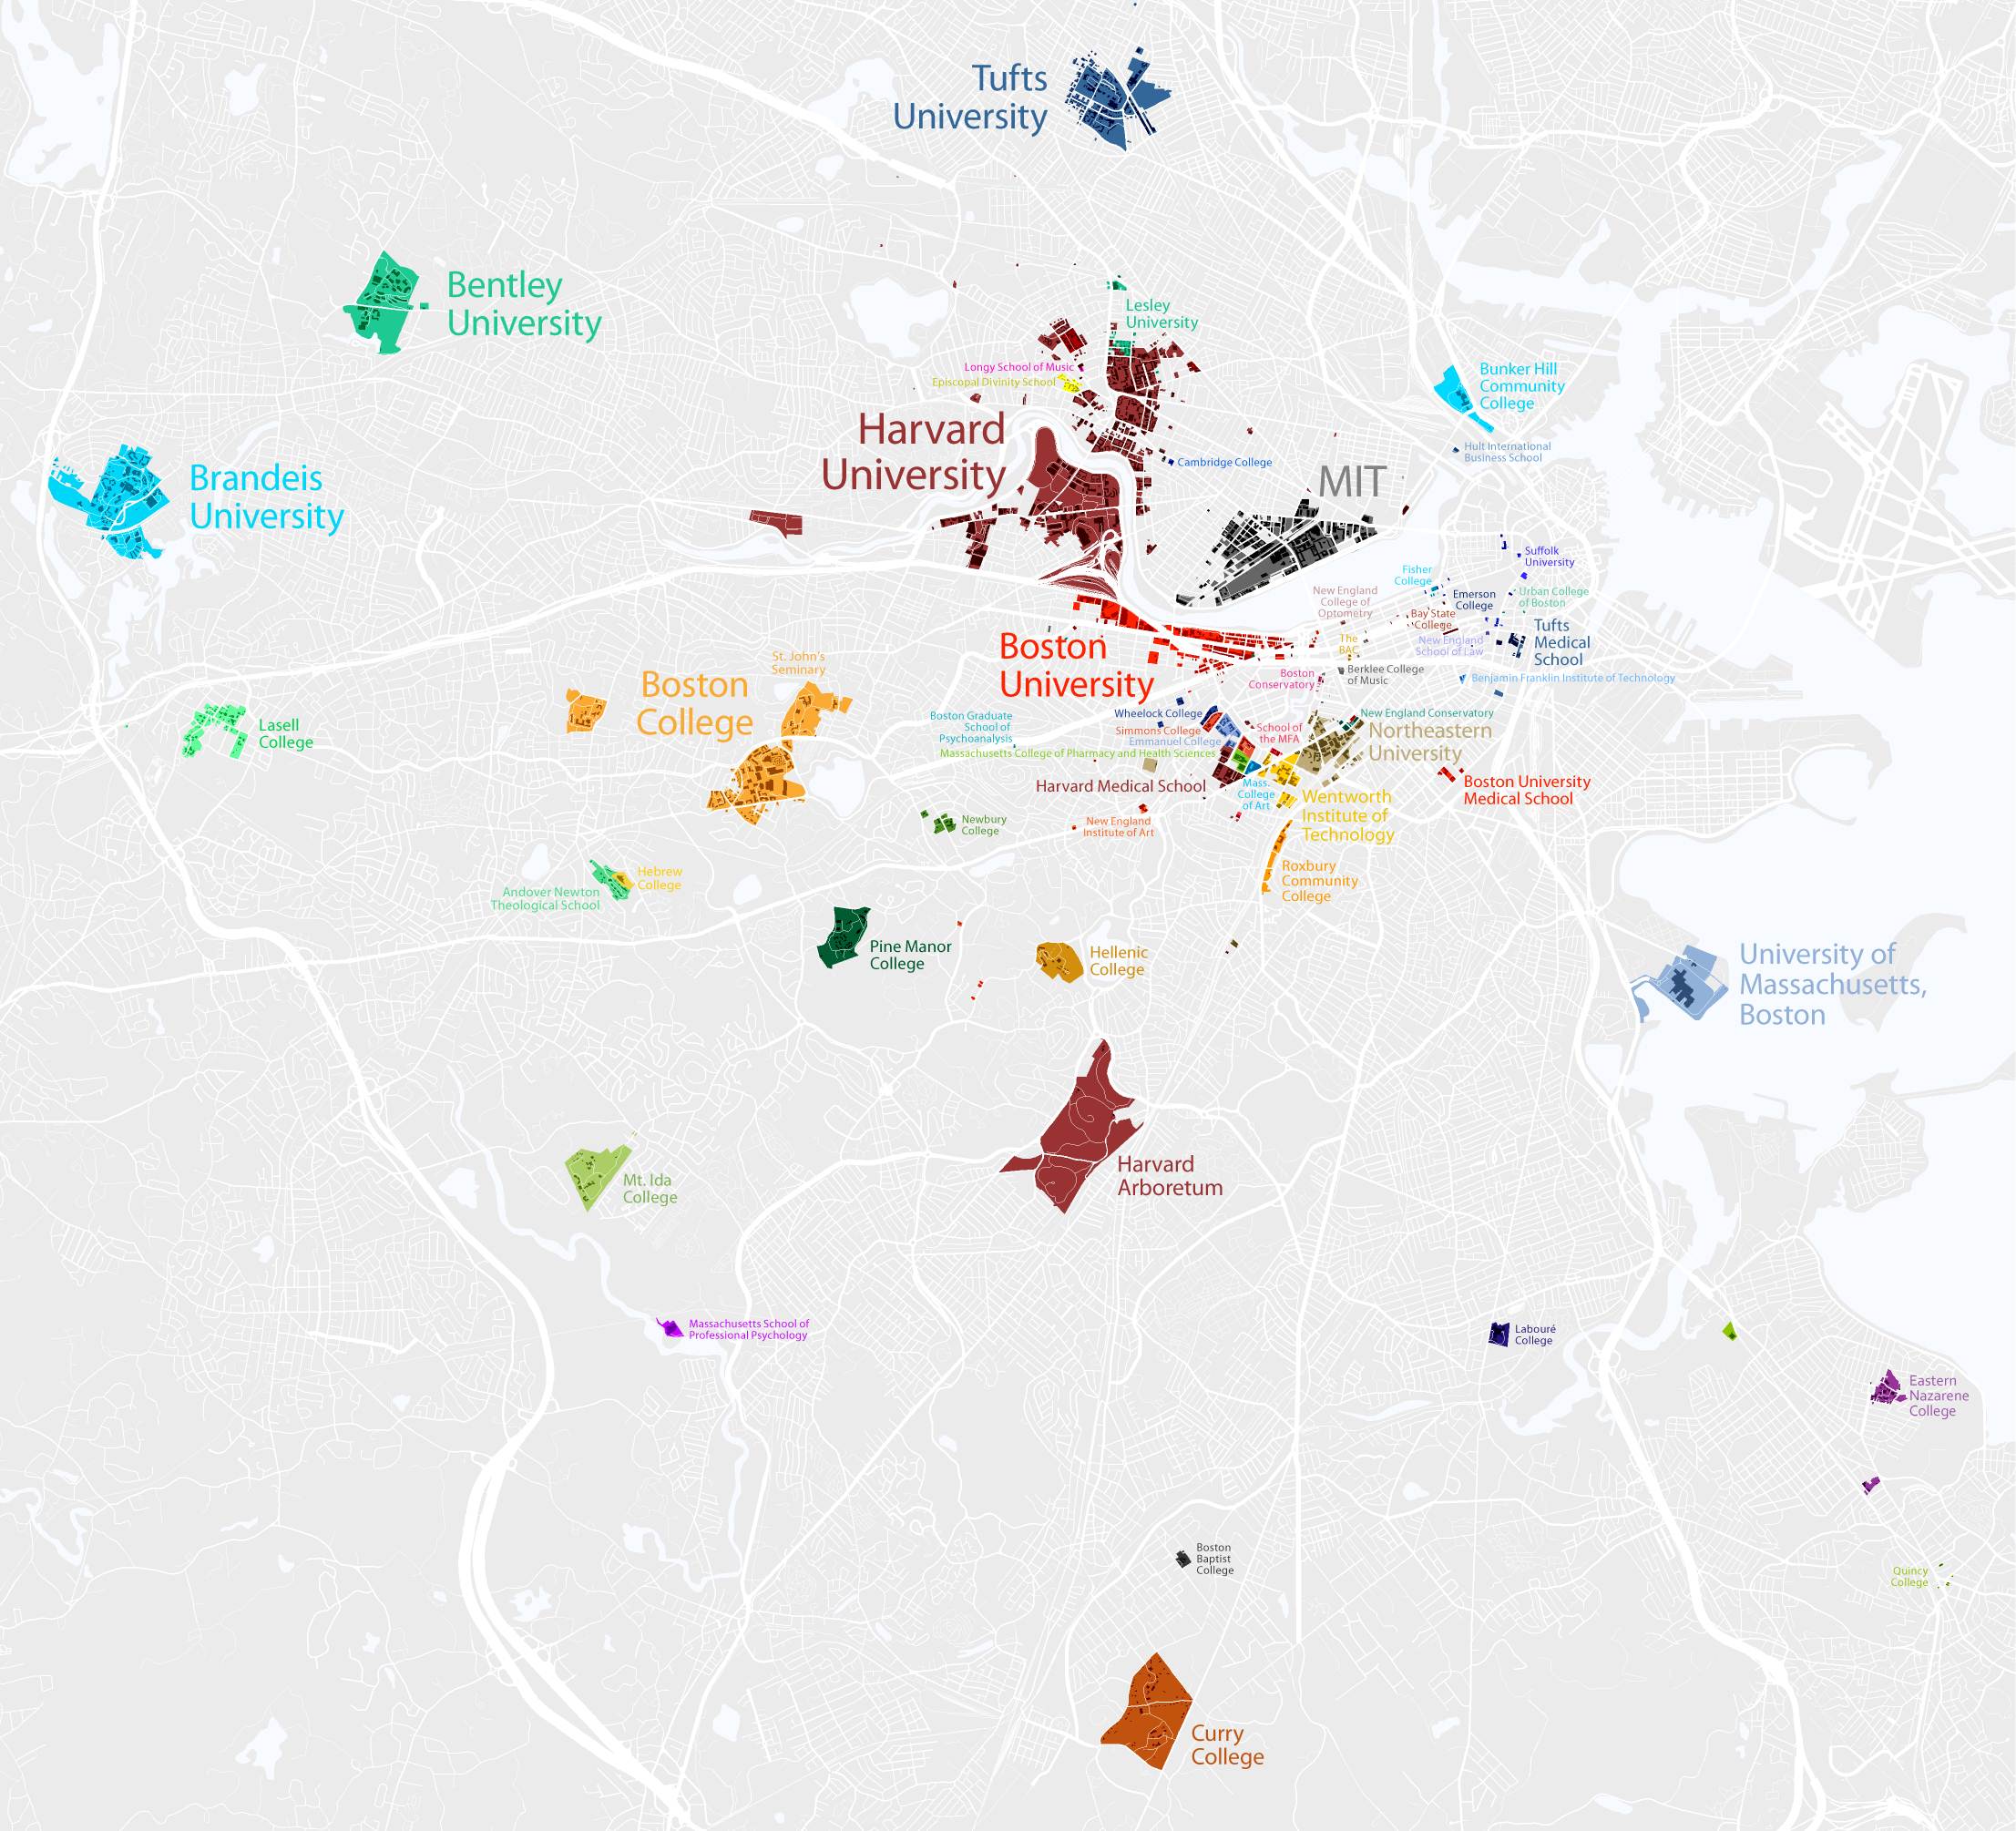
(Ronkin, 2009)
7. Transportation
While it is difficult to isolate transportation data for our selected region, Boston and its surrounding metro area is a hub of transportation activity.
Using the over 36,000 miles of roads statewide, there are about 5 million vehicles traveling 150 million miles each day in Massachusetts, which includes both in-state and out-of-state drivers.
The I-93/I-95 (128) Interchange in Woburn and Reading is the highest traffic volume location with about 375,000 vehicles each weekday. These two busy highways cut right through the Greater Boston Region.
Public transportation is another heavily utilized asset in the region. According to the Massachusetts Department of Transportation (MassDOT), “over 730,000 daily trips are made on the subway system, over 350,000 trips by MBTA bus, and 140,000 trips on the commuter rail” using the Massachusetts Bay Transportation Authority (MBTA) system (Massachusetts Department of Transportation, 2010). The MBTA offers all of these services within the Greater Boston region. See MBTA system map on the next page.
All MBTA/MBCR Commuter Rail lines have most, if not all, of their stops in the Greater Boston region we are analyzing. The same is true for the Rapid Transit liMassachusetts is home to 39 public use airports, most notably Logan International Airport in Boston. According to the MassDOT, Logan was ranked “the 20th-busiest airport in North America in terms of passenger volume and 21st in terms of aircraft movement” (Massachusetts Department of Transportation, 2010).
(Massachusetts Bay Transportation Authority, 2012)
Works Cited
Administration, U.S. Department of Commerce – Economics and Statistics. (2011). How People Get To Work – Comparing Cities: 2011. U.S. Census Bureau.
Boston Redevelopment Authority. (2011, March 1). Boston by the Numbers: Colleges and Universities. Retrieved March 8, 2013, from Boston Redevelopment Authority: Research Division: http://www.bostonredevelopmentauthority.org/PDF/ResearchPublications/BBNCollegesUniversities.pdf
Bureau of Labor Statistics. (2011, April 8). College Enrollment and Work Activity of High School Graduates News Release. Retrieved March 8, 2013, from Bureau of Labor Statistics: http://www.bls.gov/news.release/archives/hsgec_04082011.htm
Bureau, U.S. Census. (2000). Income Distribution in 1999 of Households and Families. American Fact Finder. Washington DC: 2000 Census.
Bureau, U.S. Census. (2010). Means of Transportation to Work. Boston: American Community Survey 1-Year Means.
Bureau, U.S. Census. (2011). Median Income in the Past 12 Months (In 2011 Inflation-Adjusted Dollars). American Fact Finder. Washington DC: American Community Survey 1-Year Estimates.
Bureau, U.S. Census. (2011). Selected Population Profile in the United States. American Fact Finder. Washington DC: American Community Survey 1-Year Estimates.
Bureau, U.S. Census. (2000). Selected Population Profiled in the United States: 2000. Washington DC: 2000 Census.
Census, U. (2011). Work Status in the Past 12 Months. American Community Survey.
Commonwealth of Massachusetts. (2001 & 2011). Employment and Wages by Industry and Area. Boston: Executive Office of Labor and Workforce Development.
Federal Bureau of Investigation. (2010, December 30). Uniform Crime Reports: Crime in the United States by Metropolitan Statistical Area. Retrieved March 12, 2013, from Federal Bureau of Investigation: http://www.fbi.gov/about-us/cjis/ucr/crime-in-the-u.s/2010/crime-in-the-u.s.-2010/tables/table-6
Federal Bureau of Investigation. (2010, December 30). Uniform Crime Reports: Crime in the United States by Volume and Rate per 100,000 Inhabitants, 1991-2010. Retrieved March 12, 2013, from Federal Bureau of Investigation: http://www.fbi.gov/about-us/cjis/ucr/crime-in-the-u.s/2010/crime-in-the-u.s.-2010/tables/10tbl01.xls
Florida, R. (2011). Rise of The Creative Class – Revisited. New York, NY.
Labor, U. D. (2001 & 2011). Quarterly Census of Employment & Wages. Washington DC: Bureau of Labor Statistics.
Labor, U.S. Department of. (2013). Labor Force Statistics from the Current Population Survey. Washington DC: Bureau of Labor Statistics.
Layton, L. (2013, January 22). National public high school graduation rate at a four-decade high. Retrieved March 1, 2013, from Washington Post: http://articles.washingtonpost.com/2013-01-22/local/36472838_1_graduation-rate-dropout-rate-asian-students
Massachusetts Bay Transportation Authority. (2012, January 1). Subway Map. Retrieved March 25, 2013, from MBTA: http://mbta.com/schedules_and_maps/subway/
Massachusetts Department of Elementary and Secondary Education. (2011, January 1). 2009-10 Graduates Attending Institutions of Higher Education (District) All Colleges and Universities – All Students. Retrieved March 1, 2013, from Massachusetts Department of Elementary and Secondary Education: http://profiles.doe.mass.edu/state_report/gradsattendingcollege.aspx
Massachusetts Department of Elementary and Secondary Education. (2011, January 1). 2010 Graduation Rate Report (DISTRICT) for All Student 4-Year Graduation Rate. Retrieved March 3, 2013, from Massachusetts Department of Elementary and Secondary Education: http://profiles.doe.mass.edu/state_report/gradrates.aspx
Massachusetts Department of Transportation. (2010, December 30). Transportation Facts. Retrieved March 9, March, from Massachusetts Department of Transportation: http://www.massdot.state.ma.us/portals/0/docs/infoCenter/docs_materials/MassDOT_TransportationFacts.pdf
Massachusetts Office of Travel & Tourism. (2013, March 1). Plan Your Trip. Retrieved March 15, 2013, from Massachusetts Office of Travel & Tourism: http://www.massvacation.com/find/results.php?cid=1&asgid=2&agid=0&ns-city=&ns-region=1&ns-zip=&ns-radius=25&ns-kwords=&x=34&y=5
Mauricio, K. (2012, June 20). Mapping New England. Retrieved March 10, 2013, from Federal Reserve Bank of Boston: http://www.bos.frb.org/commdev/c&b/2012/summer/expenditures-per-public-school-student.htm
National Association of Realtors. (2013, March 1). Affordability Index of Existing Single-Family Homes for Metropolitan Areas. Retrieved March 10, 2013, from National Association of Realtors: http://www.realtor.org/sites/default/files/reports/2013/embargoes/hai-metro-2-11-asdlp/metro-affordability-2012-existing-single-family-2013-02-11.pdf
Ronkin, B. (2009, January 1). College Town. Retrieved March 23, 2013, from Radical Cartography: http://www.radicalcartography.net/index.html?boston_campus
Sperling’s Best Places. (2013, March 1). Sperling’s Best Places. Retrieved March 20, 2013, from Climate in Essex County, Massachusetts: http://www.bestplaces.net/climate/county/massachusetts/essex
Sperling’s Best Places. (2013, March 1). Sperling’s Best Places. Retrieved March 20, 2013, from Climate in Suffolk County, Massachusetts: http://www.bestplaces.net/climate/county/massachusetts/suffolk
Sperling’s Best Places. (2013, March 1). Sperling’s Best Places. Retrieved March 20, 2013, from Climate in Norfolk County, Massachusetts: http://www.bestplaces.net/climate/county/massachusetts/norfolk
Sperling’s Best Places. (2013, March 1). Sperling’s Best Places. Retrieved March 20, 2013, from Climate in Middlesex County, MA: http://www.bestplaces.net/climate/county/massachusetts/middlesex
U.S. Census Bureau. (2012, January 1). Public Education Finances: 2010. Retrieved March 5, 2013, from U.S. Census Bureau: http://www2.census.gov/govs/school/10f33pub.pdf
U.S. News & World Report. (2013, January 1). Best Hospitals in Massachusetts. Retrieved March 5, 2013, from U.S. News & World Report: http://health.usnews.com/best-hospitals/area/ma
[1] Note that the U.S. and Massachusetts industry employment data used in this analysis are annual averages from the U.S. Department of Labor’s Quarterly Census of Employment & Wages, formerly ES-202 and the Massachusetts Executive Office of Labor & Workforce Development’s ES-202.
[2] Comparison of the overall % shift as well as overall shift in jobs for each sector and the regional economy as a whole matches the overall change in employment for each sector during this time period ensuring the accuracy of all shift-share calculations included in this analysis